
Highlights
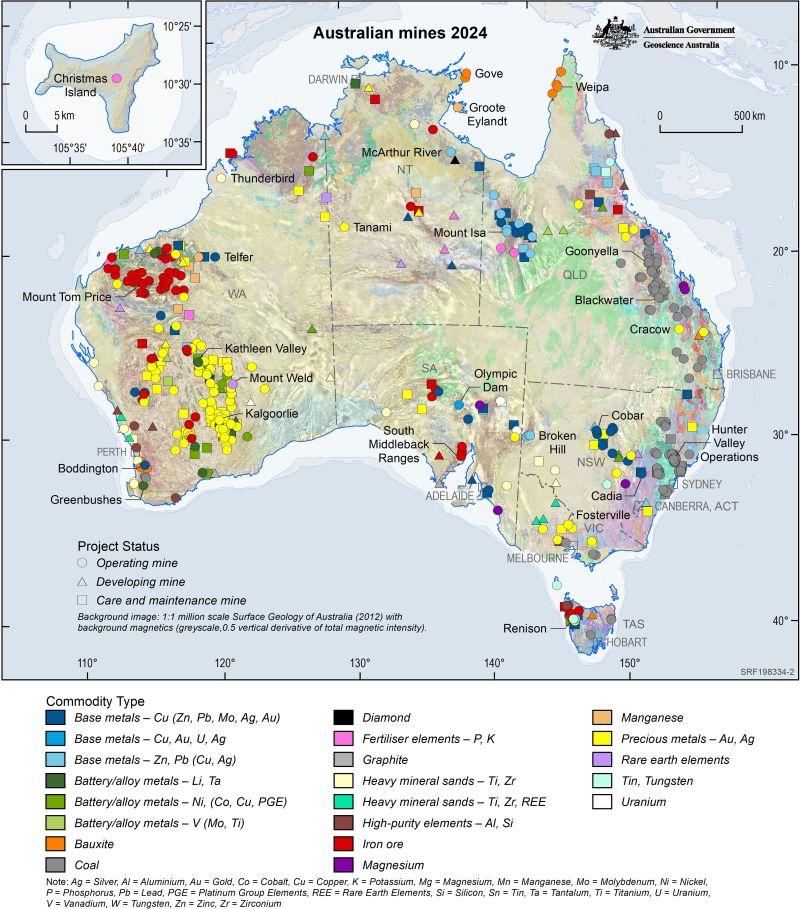
- Geoscience Australia's 2025 map tracks 340+ operating mines with nearly 100 producing critical minerals like lithium and rare earths, positioning Australia as a key supplier for electrification and defense supply chains.
- Copper emerges as a backbone metal with 8 projects advancing for grid infrastructure, while gold sees aggressive expansion with 11 new mines and 19 in development, driven by safe-haven demand.
- Australia's upstream mining strength is clear, but without parallel investment in processing, refining, and magnet production, value capture risks remain offshore, primarily in China.
Geoscience Australia’s 2025 Operating Mines Map—covering 340+ sites—reveals a mining sector pivoting decisively toward critical minerals, while legacy commodities like iron ore and gold remain dominant. For investors and policymakers, the map is not just geographic—it is strategic intelligence on supply chain positioning in a fragmented global market.
A Sector in Transition
The dataset shows nearly 100 mines producing critical or strategic materials, including lithium, rare earths, and battery metals. This reflects Australia’s accelerating role in supplying inputs for electrification, defense, and advanced manufacturing. Meanwhile, 56 projects are in development, most tied to clean energy supply chains—underscoring long-cycle capital commitments now moving toward execution.
Copper and Gold Surge—But for Different Reasons
Copper is emerging as a backbone metal, with eight projects advancing, signaling structural demand tied to grids and electrification. Gold, by contrast, is responding to macro conditions: 11 new mines online and 19 in development, driven by price strength and safe-haven flows.
REEx Insight: Geography Is Strategy
This map reinforces a core REEx thesis: resource location is only the first step—processing and midstream capacity determine real power. Australia’s upstream strength is clear, but without parallel investment in separation, refining, and magnet production, value capture risks remain offshore—primarily in China.
Bottom line: The map is not static—it’s a forward-looking signal of where the next supply chain battles will be fought.


0 Comments
No replies yet
Loading new replies...
Moderator
Join the full discussion at the Rare Earth Exchanges Forum →